
FootyTracker
Match organization and statistics for amateur sports.
Designed & developed
My contribution covers interface design and application development.
- Match day
- Scores & statistics
- Roles & data
The challenge
Bring teams, scores and club statistics into one place.
One product for the whole game night
Amateur clubs need attendance, teams and contributions as well as scores. This case-study map summarizes the journey described by the working service.
The visuals below come from the public page and contain demonstration data, rather than a private club dashboard.
Gather the players and get to the match
The public workflow describes attendance, team allocation and match control. Recurring game nights can reuse the previous squad, with auto-balancing offered to help distribute players.
Read the score first, then the events
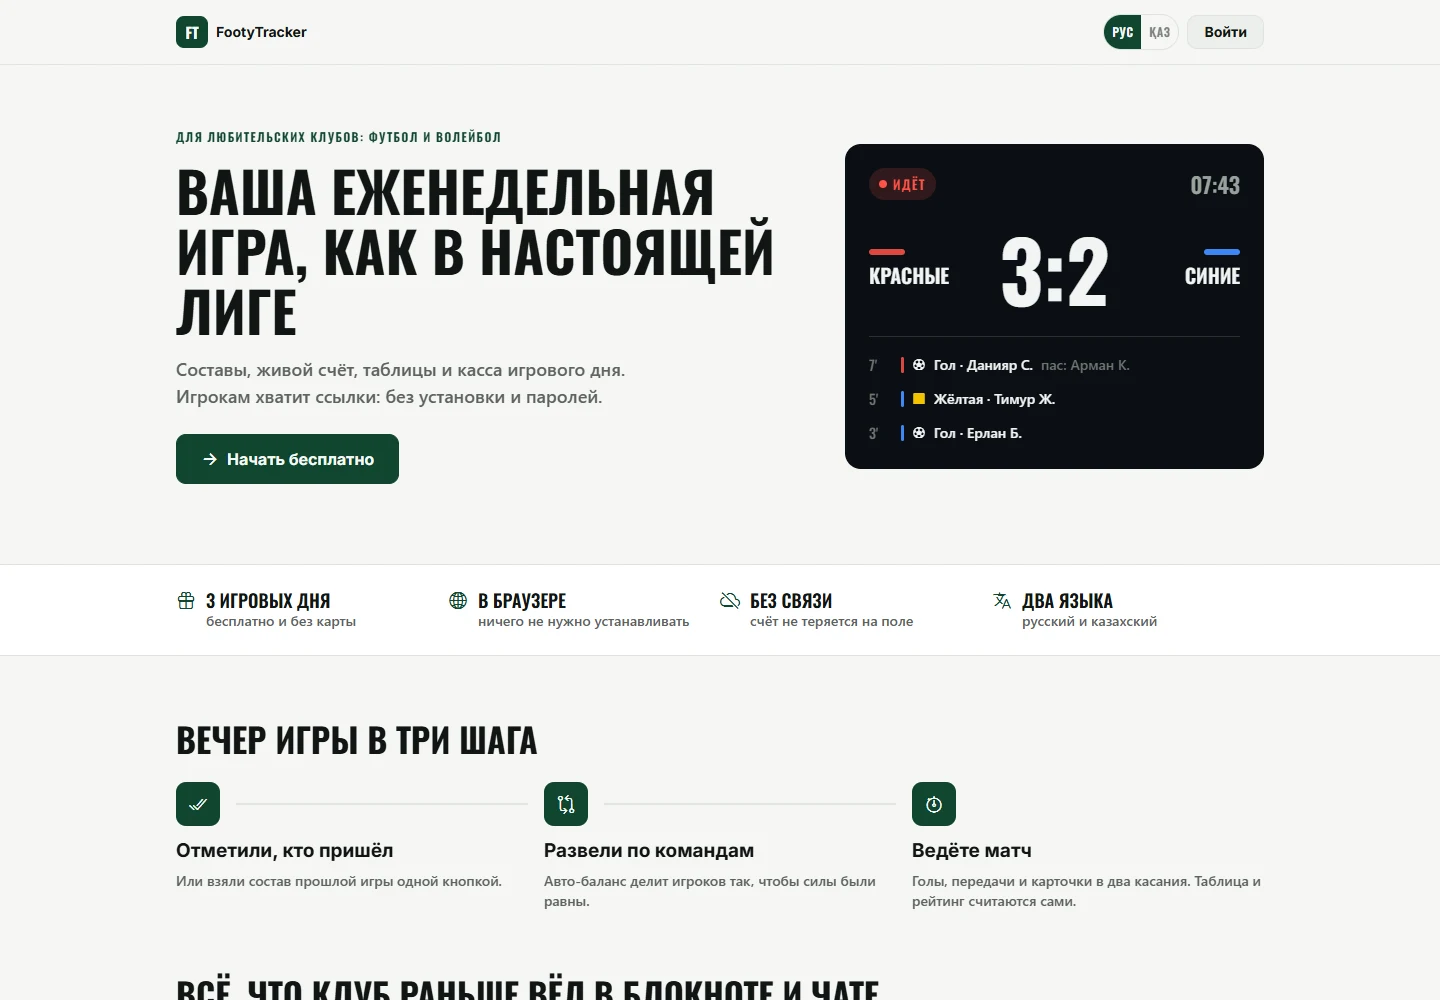
The 3:2 score leads the hierarchy. Color markers identify the teams, while status and time sit above. Events are distinguished by minute, type and player. This is the public page’s demonstration scoreboard.
A clear order for dense numbers
Each row brings together matches, wins, draws, losses, goals, difference and points. Compact headings support scanning; color and signs distinguish positive and negative differences, with points concluding the row.
A personal link is enough for the player
The card combines the next game, attendance response and personal statistics. Attending and unavailable actions answer the organizer’s key question, while goals, assists and games sit below.
Keep contributions in the game context
The collected amount and payer count lead the summary: 54,000 ₸ and 12 of 14. The public description also mentions debt tracking and prepared reminders. The visual shows the publicly available summary.
One visual identity across data types
The dark scoreboard emphasizes the live game. A light table supports comparison, the green player card supports action, and the lime summary highlights money. Inspect the actual interface excerpts below.
Tabular and financial data+
From interfaces to data and permissions
Project documentation identifies Expo Router, TypeScript, React Query, Zustand and Supabase. Organizer, game administrator and viewer roles have separate access, with company data isolated by RLS. The public site also explains offline operation and link-based access.
From invitation to scoreboard on a phone
The mobile opening stacks the service proposition, primary action and scoreboard. Large numbers and team names retain priority. On desktop, the text and scoreboard sit side by side.
Full public page+
The project’s character
A sports editorial style: condensed headings, prominent numbers and a dark scoreboard on a light foundation.
0123456789
#10452F#111614#F5F6F4#E0483FOswald + Inter
Oswald defines headlines and scores. Inter appears in emphasized labels and actions, while the web version uses system fonts for body text.
Color helps distinguish events
Green connects branding and primary actions. Team colors and event markers distinguish the score from supporting data.
The outcome
Interfaces for match days, scores, standings and players, backed by a database and role-based access.
Visit website ↗